
QGIS Lessons from the Humanitarian OpenStreetMap Team
"Find a spatial dataset that represents the extent of the disaster and using OSM data for that area, calculate the infrastructure that may have been affected."
Activity: share a completed map that focuses on disaster affected infrastructure. For a disaster that has occurred in the past, find a spatial dataset that represents the extent of the disaster (e.g. flood extent, earthquake affected area, hurricane path) and using OSM data for that area, calculate the infrastructure that may have been affected (e.g. roads, buildings, points of interest). Represent your findings in a completed map layout that includes: Title; Legend; Source; CRS and Date information; Scale bar and north arrow;Inset map (optional). Upload a PDF of your completed map below including a short piece of commentary describing the map.
At first, I wanted to map the most recent major Bekasi flood of March 2025.
Heavy rainfall from Monday through Tuesday, March 3–4, 2025, triggered severe flooding in several parts of Greater Jakarta (Jabodetabek). The Bekasi River overflowed due to intense rain in the upstream area of Bogor combined with local downpours in Bekasi City, leaving at least seven districts inundated by Tuesday afternoon. Pondok Gede Permai and Villa Jatirasa were among the worst-hit neighborhoods. The river’s overflow also breached a levee near the Mega Bekasi Hypermall, flooding the mall’s ground floor. Water began entering the building at around 8:00 a.m. on Tuesday, March 4, and within an hour and a half, the entire floor was submerged. Dozens of shopkeepers preparing to open their stores were forced to evacuate to the upper levels. This marks the second time the mall has been hit by flooding, the last incident occurring in 2017.
A few days ago—thanks to a certain WeeklyOSM entry—I learned how to access Copernicus satellite imagery.
The first problem was that the satellite might not have captured Bekasi on the day of the disaster. Apparently, the satellite only covers a specific region of the Earth every few days. So, I checked the news archives, confirmed the disaster date, and then checked the availability of satellite images for that day.
Fortunately, the satellite did pass over Bekasi on the day of the disaster.
Unfortunately, Bekasi was still shrouded in thick cloud cover, so I couldn’t see anything about the extent of the flooding.
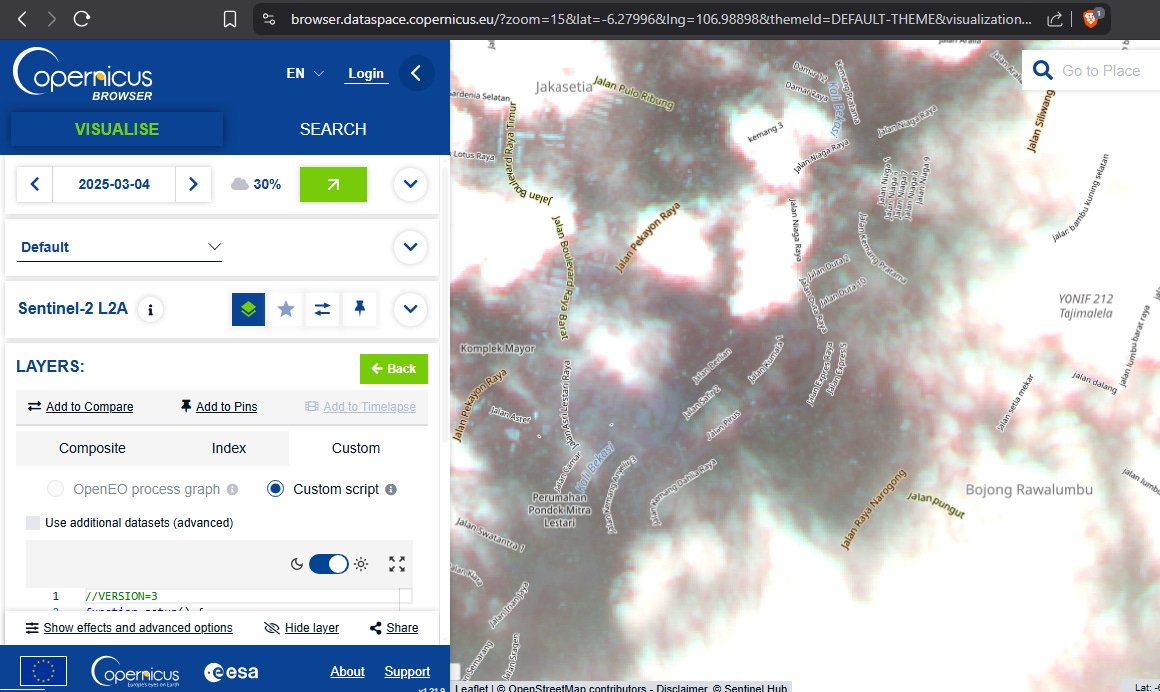
I tried running a script I had prepared earlier—one that uses the satellite’s infrared band to detect water bodies, man-made structures, and vegetation—but the cloud cover was still too thick. I couldn’t draw any proper conclusions.
So, I thought maybe I should give up on this attempt.
I went back to the Humanitarian OpenStreetMap Team learning platform to check the community discussion posts, hoping that people in the past might have shared clues on how to obtain disaster data.
Thanks to a certain post from nine months ago about using USGS shake intensity mapping, I immediately went to the USGS site and searched for recent earthquakes in Indonesia.
Finally, I found one: the M 6.1 Nabire earthquake.
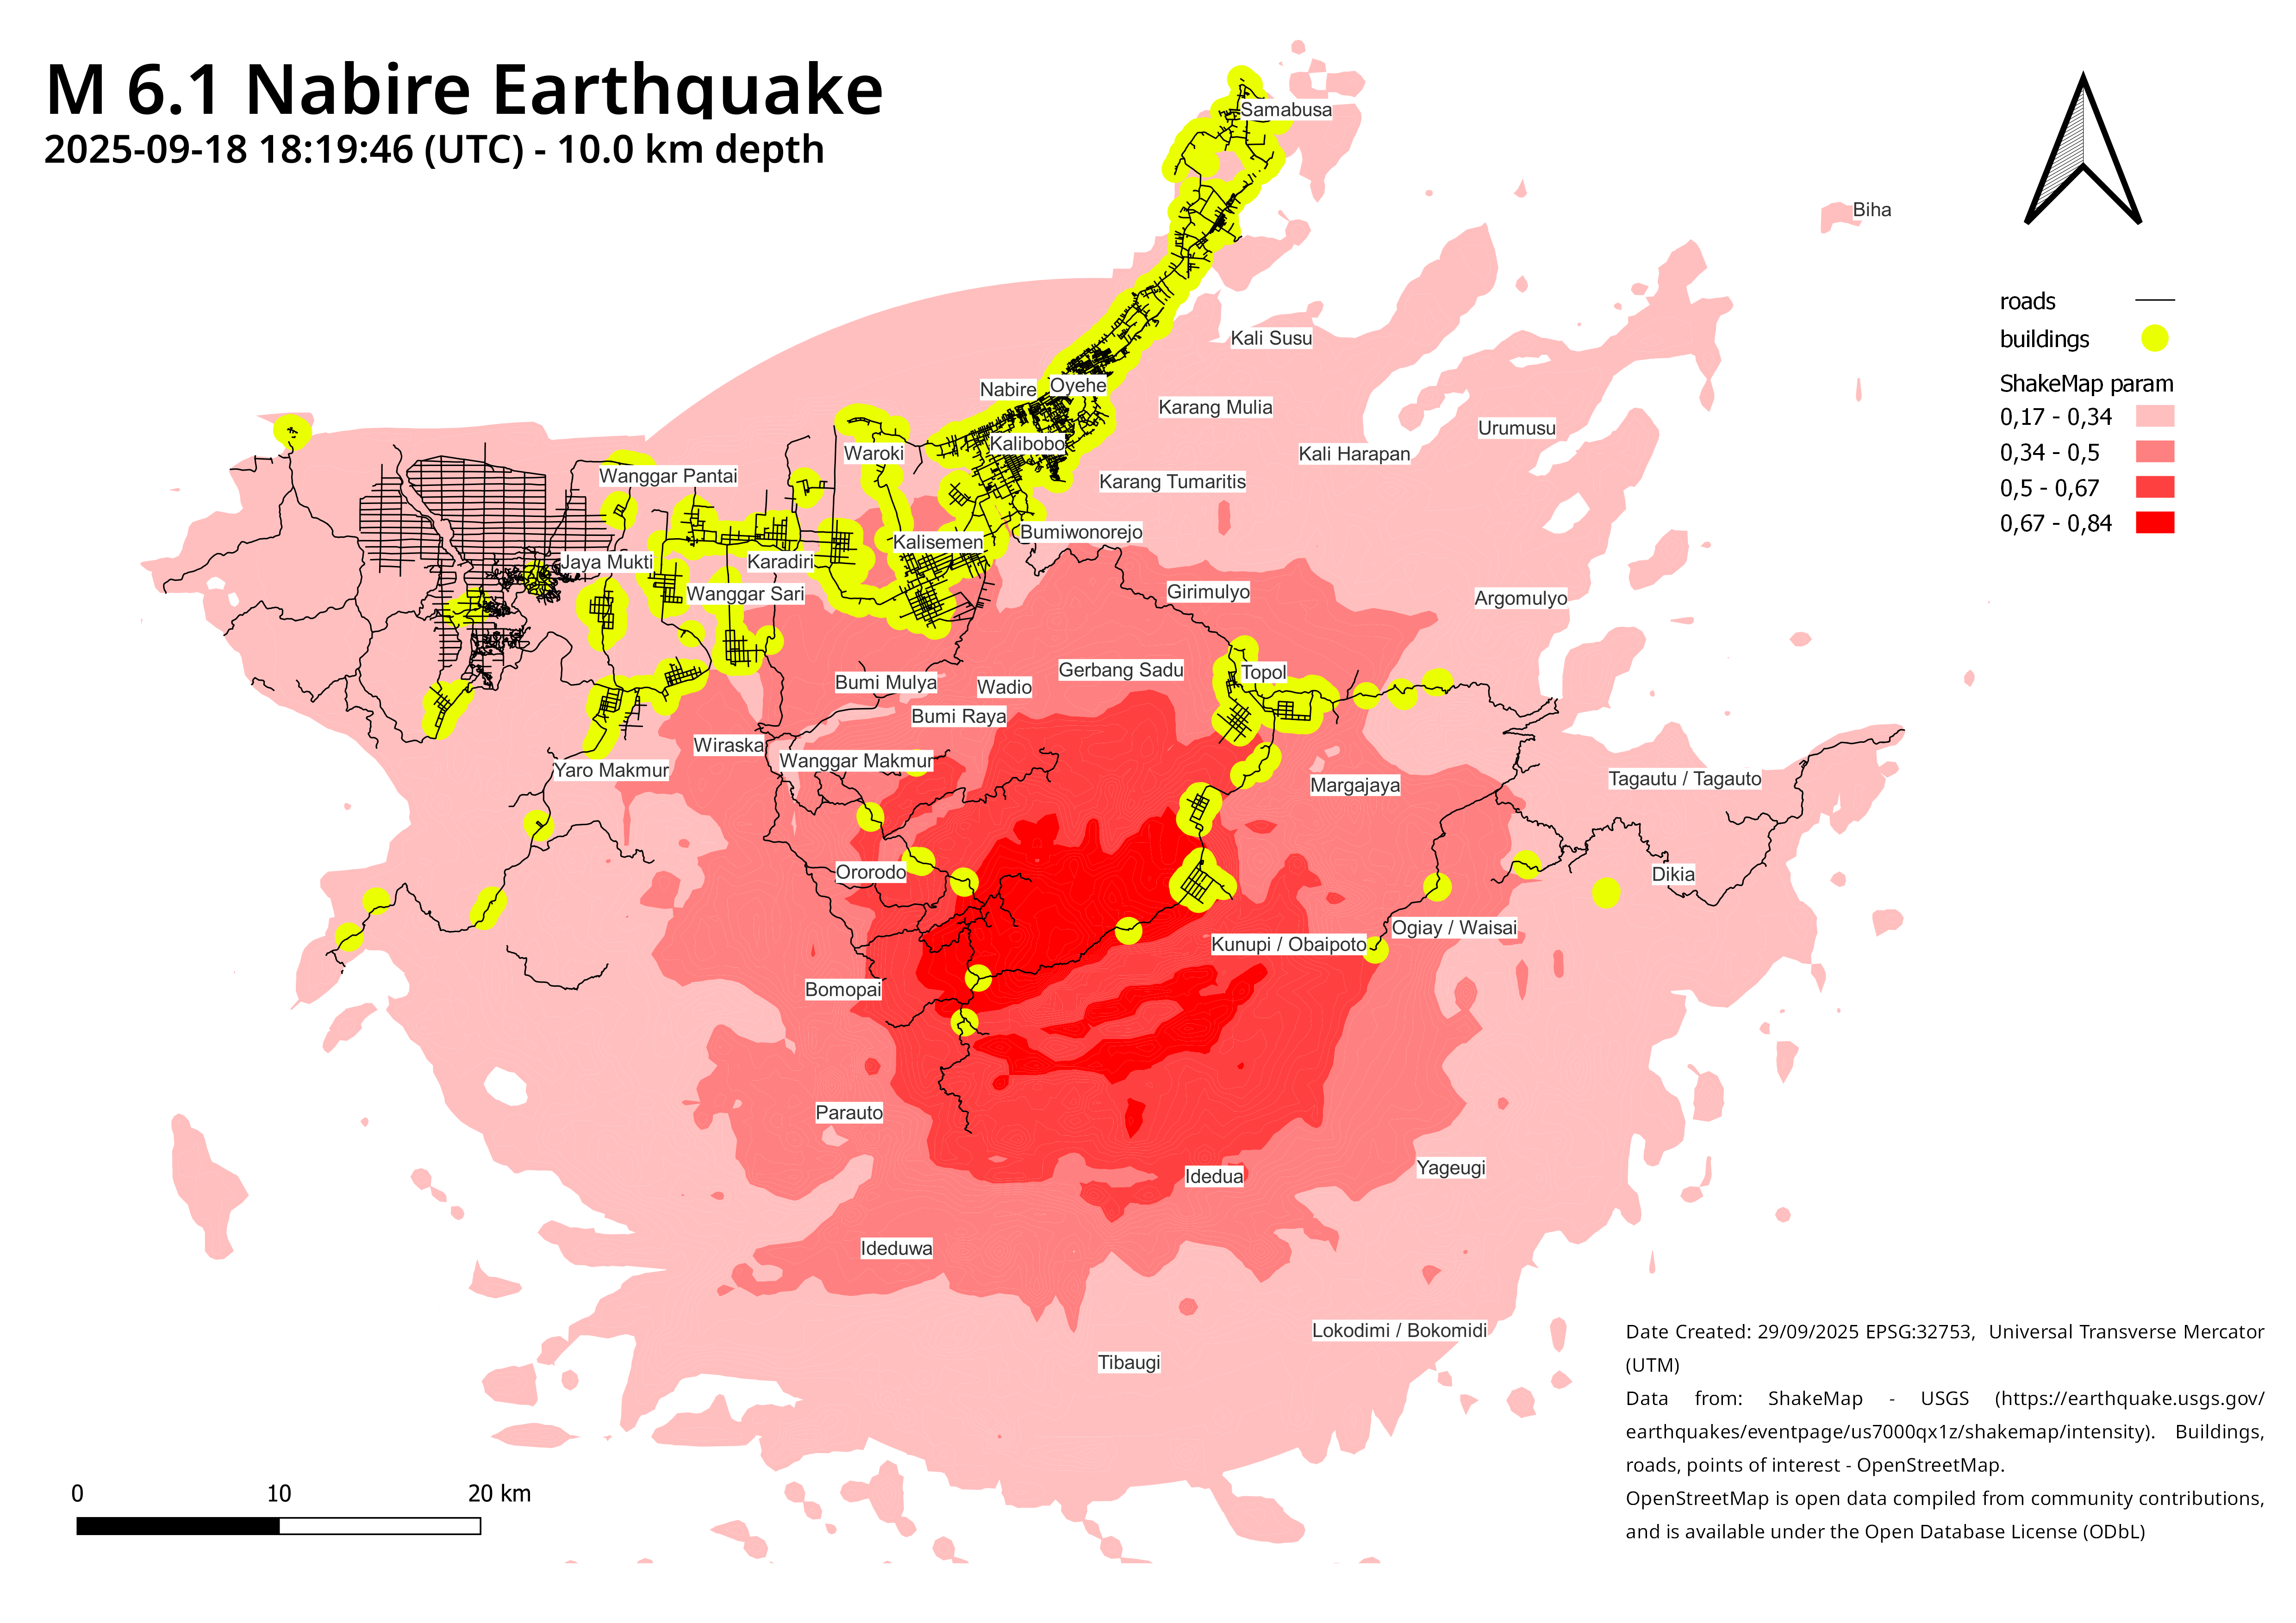
A tectonic earthquake with a magnitude of 6.1 struck Nabire, Central Papua, in the early hours of Friday, September 19, 2025, at 3:19 a.m. local time. The epicenter was located at 3.47°S and 135.49°E, with a depth of 10 kilometers, making it relatively shallow and potentially damaging. The quake was triggered by activity along the Weyland Thrust Fault. The tremor caused significant damage, including collapsed buildings, severed bridges, and disruptions to electricity and telecommunications. Shaking was also felt in Wasior, Teluk Wondama; Enarotali, Paniai; Timika, Mimika; and as far as Biak Island.
There are several new QGIS skills I learned while working on this assignment.
First, I learned how to select a portion of the dataset:
Right-click on the layer → Open Attribute Table → Select Features Using an Expression → Build the Expression → Right-click on the layer → Save Selected Features As.
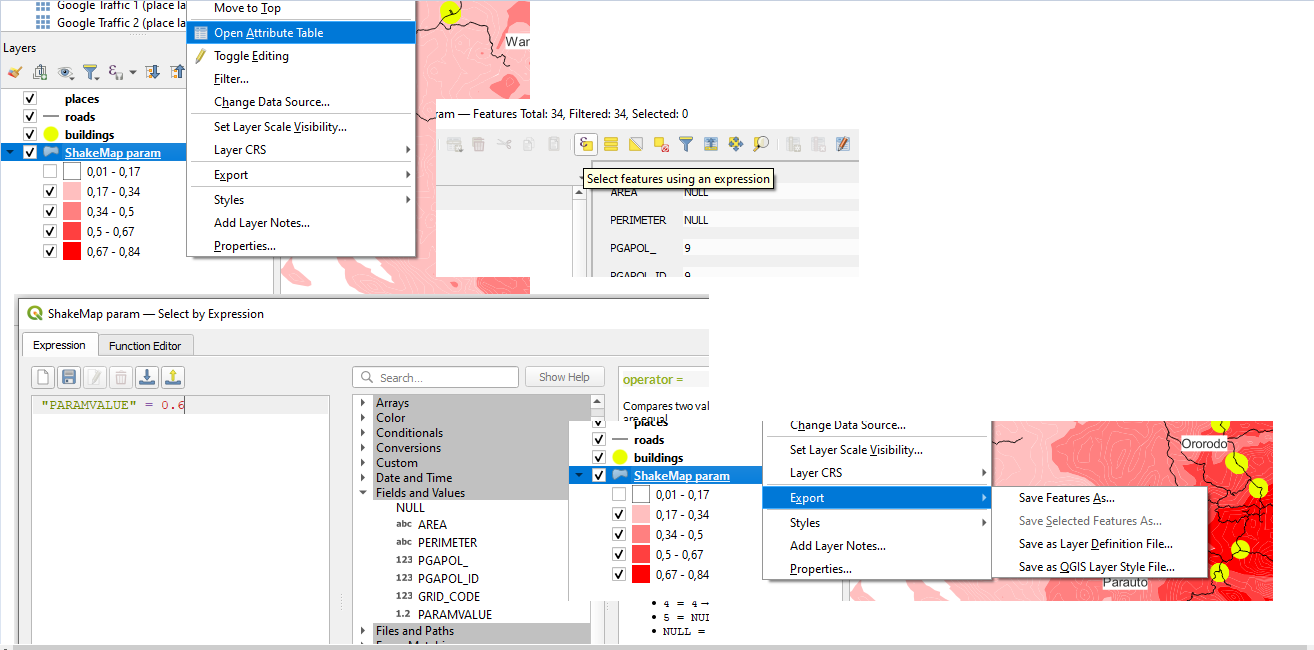
The selected features will then exist in their own separate layer.
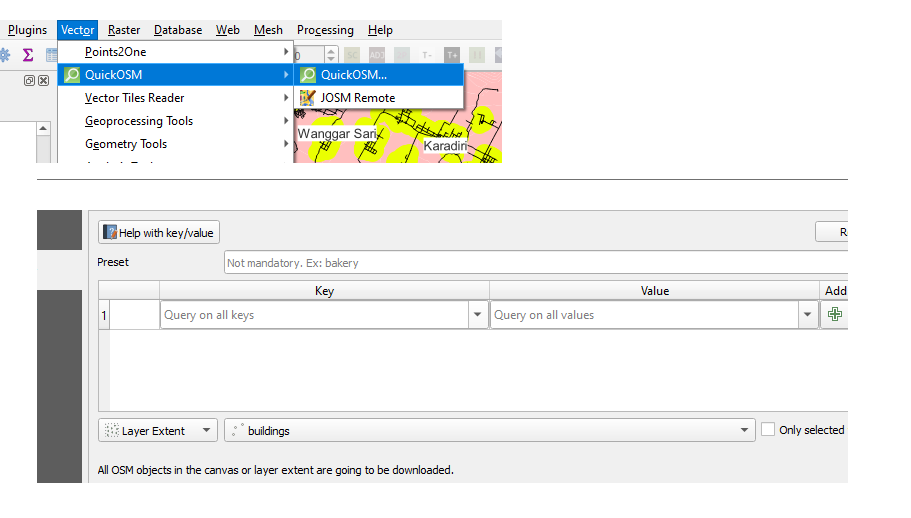
Second, I learned how to download relevant OSM objects within a predefined polygon layer.
Simply use the QuickOSM plugin and select the ‘Layer Extent’ option.
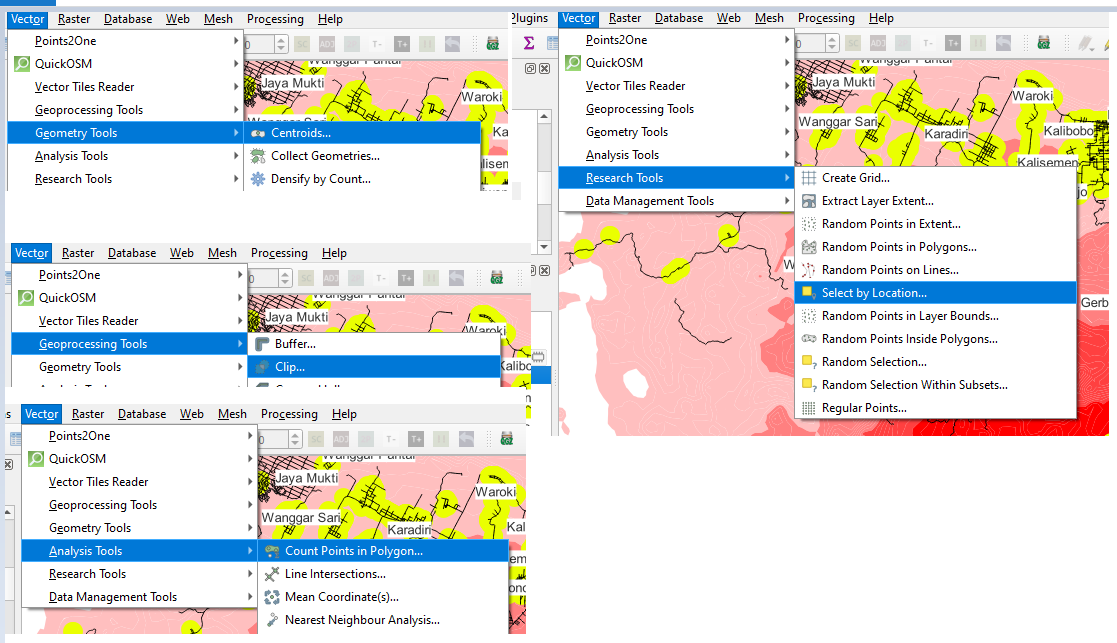
Third, I performed several operations on vector data layers.
To convert an OSM polygon into a node, I used Geometry Tools → Centroids.
To select all OSM objects located inside a polygon, I used Research Tools → Select by Location.
To “cut” OSM streets and keep only the portions located within a geographic boundary, I used Geoprocessing Tools → Clip.
To count how many points are located inside a polygon, I used Analysis Tools → Count Points in Polygon.
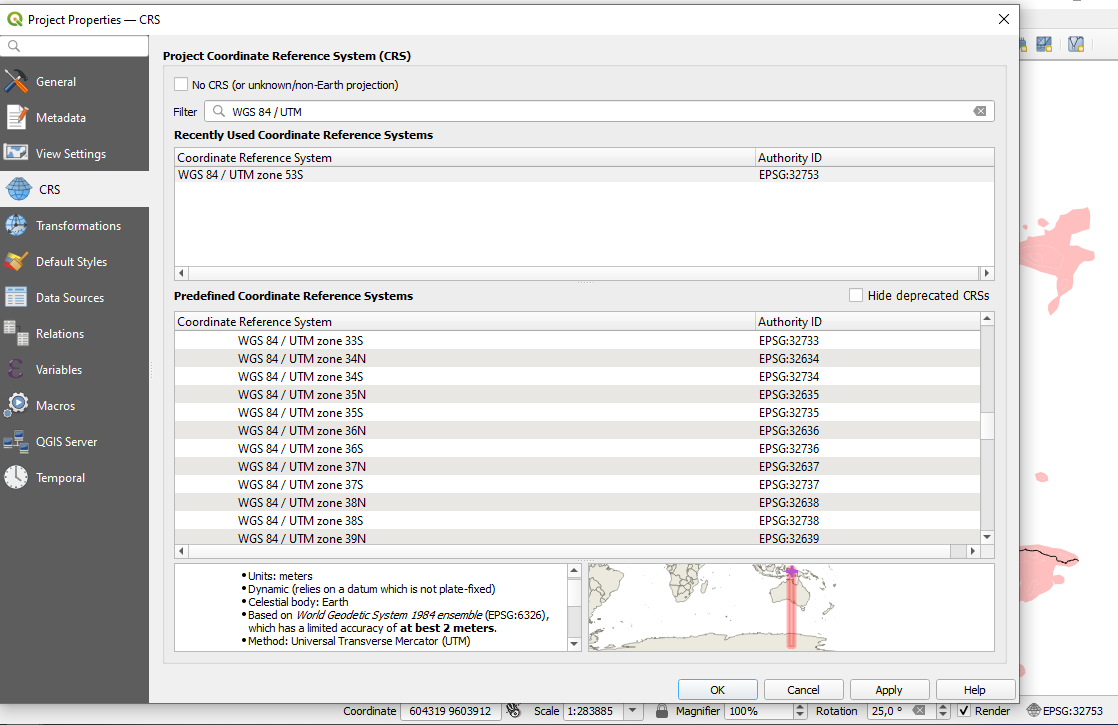
I also learned the importance of changing the coordinate reference system.
Geographic CRSs (like EPSG:4326, WGS84) use degrees of latitude and longitude as their units, which are angular measurements, not real-world distances. When you display data in a geographic CRS, the map is essentially “unprojected” and will look increasingly distorted the farther you move from the equator. For example, Greenland will appear much larger than it really is compared to countries near the equator. A projected CRS, on the other hand, converts the curved surface of the Earth into a flat map using linear units (meters or feet). This makes distances, areas, and shapes more realistic for mapping and analysis, especially at local or regional scales.
The Universal Transverse Mercator (UTM) system is a global map projection method that divides the Earth into 60 zones, each spanning 6 degrees of longitude. Within each zone, the surface of the Earth is projected using the Transverse Mercator projection, which minimizes distortion of shape, distance, and area over relatively small regions. Each zone is defined separately for the northern and southern hemispheres, labeled with “N” or “S.” Coordinates in UTM are expressed in meters, with an easting and northing value that make it straightforward to measure distances and areas. Unlike geographic coordinate systems, which use degrees of latitude and longitude, UTM provides a linear, metric-based framework that is well-suited for regional mapping, engineering, navigation, and GIS analysis. However, because each zone is optimized only for its specific 6-degree slice of the Earth, UTM is not suitable for very large areas that span multiple zones.
In the very bottom right-hand corner of QGIS you should see a button that states ‘EPSG:4326’, select it and in the window that opens add ‘32722’ to the ‘Filter’ field (this tool allows you to find other local projected CRSs). In the ‘Predefined Coordinate Reference Systems’ box, expand ‘Projected’ and ‘Universal Transverse Mercator’ and click on ‘WGS 84 / UTM zone 22S’ and hit ‘OK’. This changes the project’s overall CRS and you should see a small change in appearance in the ‘shape’ of the mapped objects, they will appear slightly less ‘stretched’.
One day after I finished this map, I learned from the news that a massive earthquake had just struck the Philippines. So I repeated the same procedure, but this time using the new data.
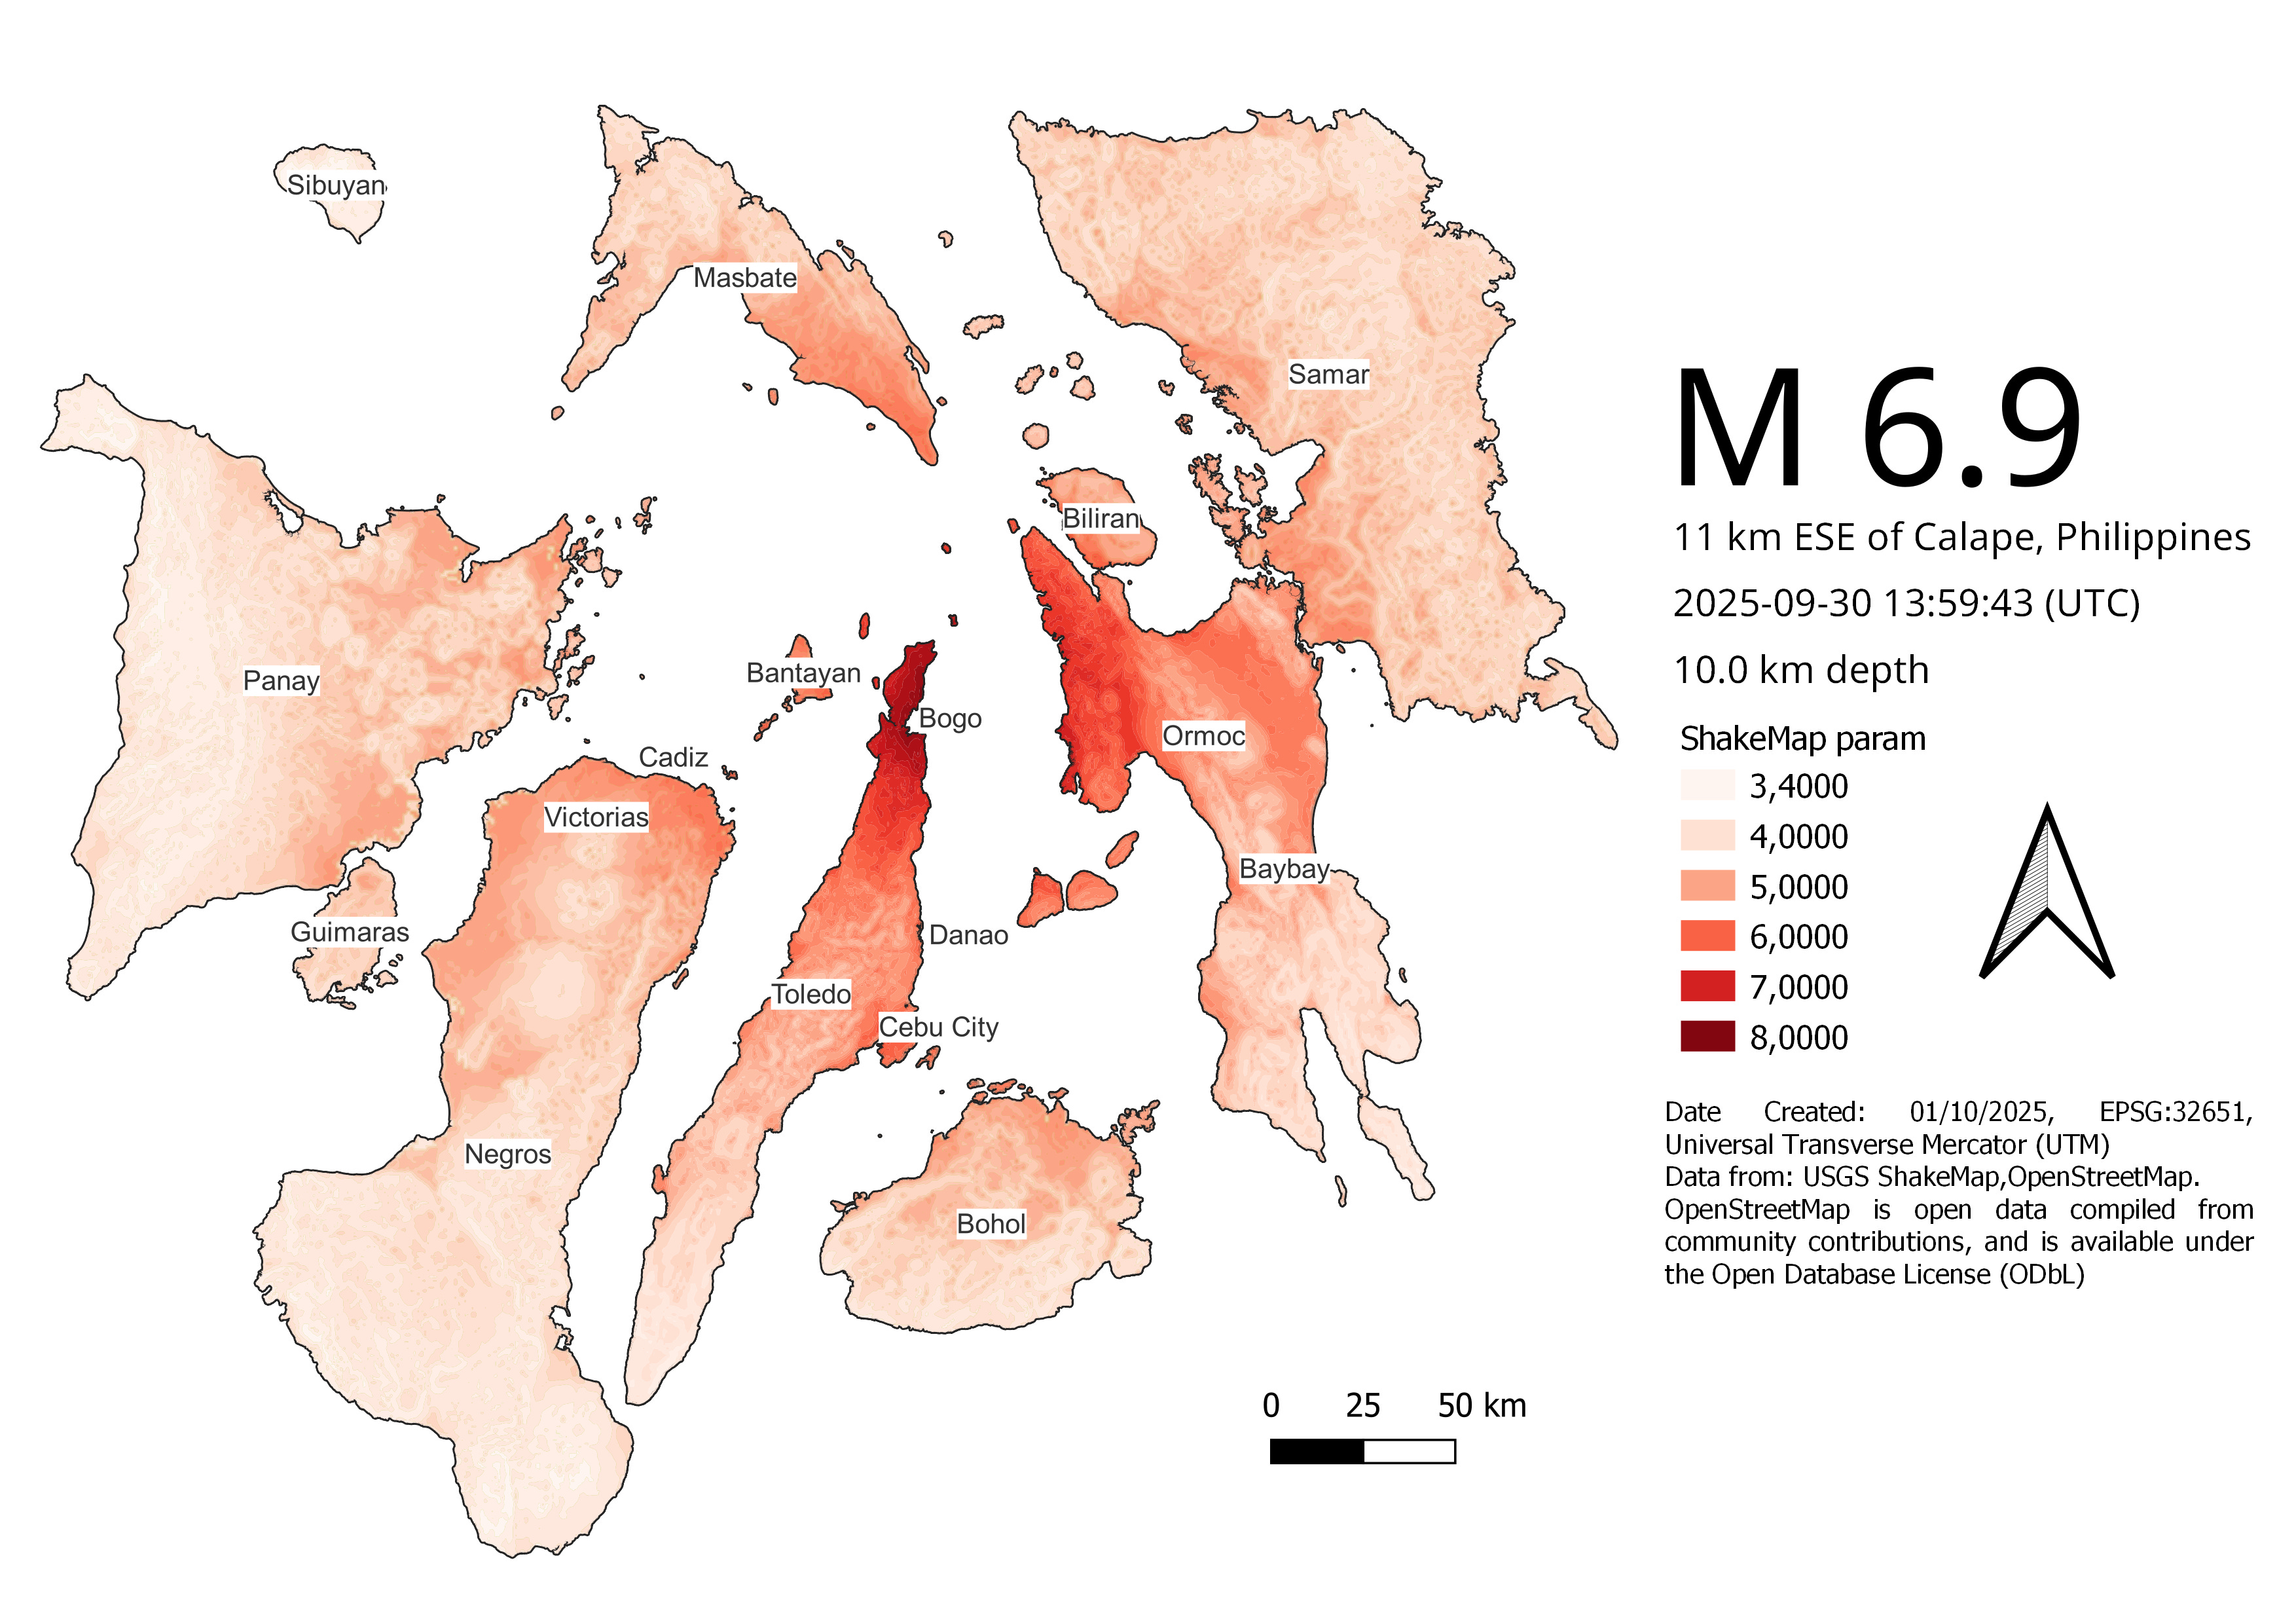
Dozens of earthquake victims lay in body bags outside a hospital in Bogo City, Cebu Province, Philippines, on the night of Tuesday, September 30, 2025. Hundreds of survivors also gathered not far from the hospital, while ambulances moved back and forth bringing in casualties for treatment. The offshore earthquake had toppled walls of houses and buildings on Tuesday night in the central Philippine province. The 6.9-magnitude quake killed at least 31 people. In the darkness, residents rushed out of their homes to seek safety. Power was cut in several areas as a result of the tremor.
The quake’s epicenter was located about 19 kilometers northeast of Bogo, a coastal city of around 90,000 residents in Cebu Province. The death toll in Bogo was expected to rise. Workers were trying to deploy excavators to speed up search and rescue efforts in mountain villages hit by landslides and falling rocks.
At least 12 people were killed when the ceilings and walls of their homes collapsed while they were asleep in the town of Medellin, near Bogo. The earthquake also damaged roads in the area.
By the afternoon of October 1, 2025, the death toll had reached 69. The Philippine Institute of Volcanology and Seismology had issued a tsunami warning and advised residents to stay away from the coastlines of Cebu and the nearby provinces of Leyte and Biliran.