Marey Charts
Track public transportation's timetable with its graphic representation of speed.
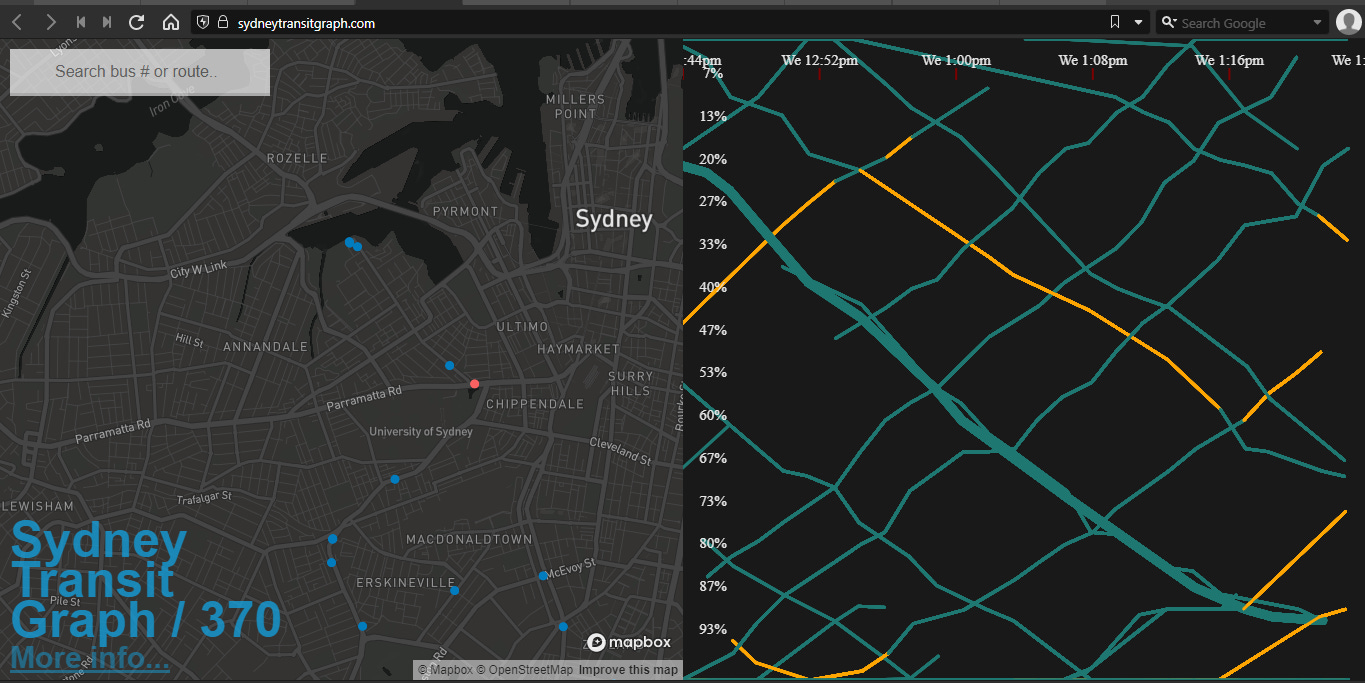
So, I stumbled across this graph from Jake Coppinger’s “Visualising Sydney bus congestion with Marey charts” blogpost. This is the first time I discovered “Marey charts”.
According to badriadhikari’s data-viz workshop : “E. J. Marey, a French scientist, proposed a graphical train schedule with a timetable and graphic representation of speed.” Here is what Marey proposed for the Paris-Lyon train service :
Quite an interesting concept. There’s so much insight and information packed into this neat graph.
Well, now how do we properly read this chart?
A single route contains several bus units. Each bus units is being tracked by using GPS. The dot shown on the left side of the graph is the position of each bus, who shared the same single route. Thus, they have exact same terminal position. Let’s call it A (starting point, located on north, 0%) and B (end point, located on south, 100%).
On the right side of the graph, we see several segment of line. Each line segment represents a bus unit movement along a route. A → B movement is represented by y-axis 0% → 100% down line🡾 . Meanwhile B → A movement is represented by y-axis 100% → 0% up line🡽. Also, you can click the line segment to track that bus’ location on the left side.
The vertical gap between the line represents the distance gap between each bus during a certain frozen time. For example, “at 1.00 pm, the distance gap between bus A and bus B is 1,25 km”.
The horizontal gap between the line represents the temporal gap (in duration) between each bus at a certain coordinate. For example, “right now, bus A is located on T bus stop. The next bus will arrive on T bus stop around 15 minutes later.”
Where two lines intersect, it means that the buses are occupying the same time-space coordinates. It simply means that they meet each other.
Warmer color (yellow) means more occupancy.
The slope of each line segment represent each bus’ speed.
When two line segments are moving too close together, it means that they are actually moving too close together. This situation is ideal if the first bus is overloaded, so the other bus could pick up the rest of the passenger. But, this situation is not ideal if the first bus occupancy is low.


