Descriptive Statistics with Orange
No spreadsheet equations, no codes, just drag and drop.
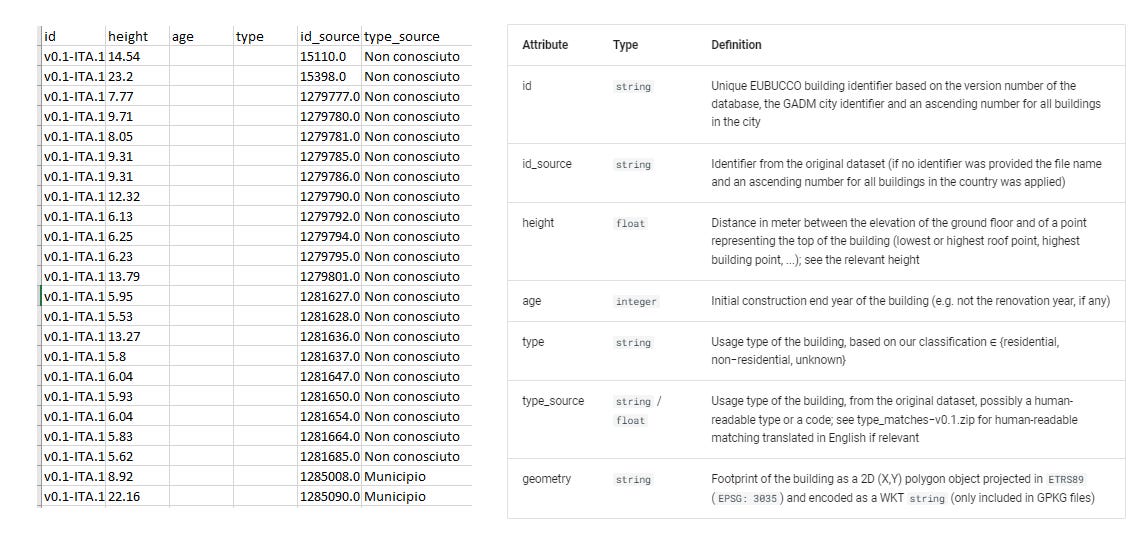
EUBUCCO is a scientific database of individual building footprints for 200+ million buildings across the 27 European Union countries and Switzerland, together with three main attributes – building type, height and construction year. EUBUCCO is composed of 50 open government datasets and OpenStreetMap that have been collected, harmonized and partly validated.
You can download the data — as a CSV file — here : https://eubucco.com/data/
Now, let’s take a glance into the data by using Orange Data Mining.
Malta. Country-level government dataset with small file size (1.54 MB).
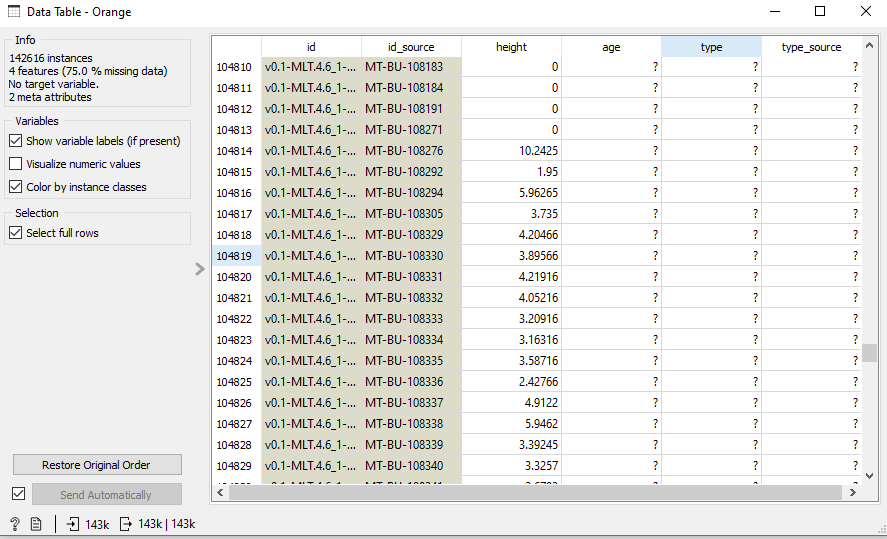
Missing data is labeled as zero height. But wait, is that a high precision height measurement? Well, they probably estimated the building height by using LIDAR (?)
Here’s the feature statistics result :
A building height data (in meters), 142.616 rows, but no data about its age and building type.
Now, how to interpret this kind of statistics?
First, the tallest building is 147 m. It’s obvious, right?
Next, the mean. It’s like “collective performance” of a whole group. Imagine there’s two country, with similar size, similar population and similar amount of building. If country A’s mean building height is 100m and country B’s mean building height is 50 m, then clearly you’ll find more tall buildings in country A.
But “collective performance” might be deceiving, especially with the inclusion of outlier data. Now imagine a district. There are 99 house, each with less than 5 m height. Then, there’s this one very tall super-skyscraper. Now the average building height is probably about half of that super-skyscraper’s original height, which is —probably — a normal office building height.
Then, you see the statistics. “Oh, this district’s average building height is about 50 m.” You are expecting to see lots of normal office building over there, but when you actually visit that district, all you see is just normal houses, with one very tall super-skyscraper right in the middle.
The fairer way to estimate “what is the true average” building height is by using a median. First, you sort the building by its height, then you pick the one building that sitting right in the middle. By using this procedure, the insane power of an outlier will be easily defeated by a mere majority power.
Here, the median is 2.9 m, while the mean is 4.8 m. Surely that 147 m skyscraper is cranking up the dataset’s whole mean building height score. While the majority of “normal looking” building here in this dataset is about just 3 meters tall.
Alright, now what is “dispersion”. First, I should directly consult to Orange’s official documentation to understand it.
For categorical features, this is the entropy of the value distribution. For numeric features, this is the coefficient of variation.
Coefficient of variation, huh? They linked a wikipedia article, full of scary equations and difficult language. I don’t have time to read this thing right now.
Instead, I asked ChatGPT to teach me.
“A small standard deviation indicates that the data points tend to be close to the mean. While a large standard deviation indicates that the data points are spread out over a wider range of values. If a set of test scores has a mean of 75 and a standard deviation of 10, this means that most scores fall within range 65 to 85 and very few scores fall outside that range.
If the mean height of a group of people is 5 feet and the standard deviation is 2 inches, the coefficient of variation is 3.33%. This means that the height of the people in the group varies by about 3.33% of the mean height.”
A smaller CV value indicates less variation in the data set relative to the mean, while a larger CV value indicates a greater degree of variation.”
ChatGPT might deceive me by its overly proud hallucination behavior, but let me just bear this risk. Let’s just assume they’re right. Now what. 1.64 %? “The height of the building in the group varies by about 1.64% of the mean height?”
I can neither confirm nor deny about this. I don’t really get it. :/


