Analisis BisKita : Behind The Scene
Panduan melakukan GPS Tracking BisKita menggunakan Tracklia.
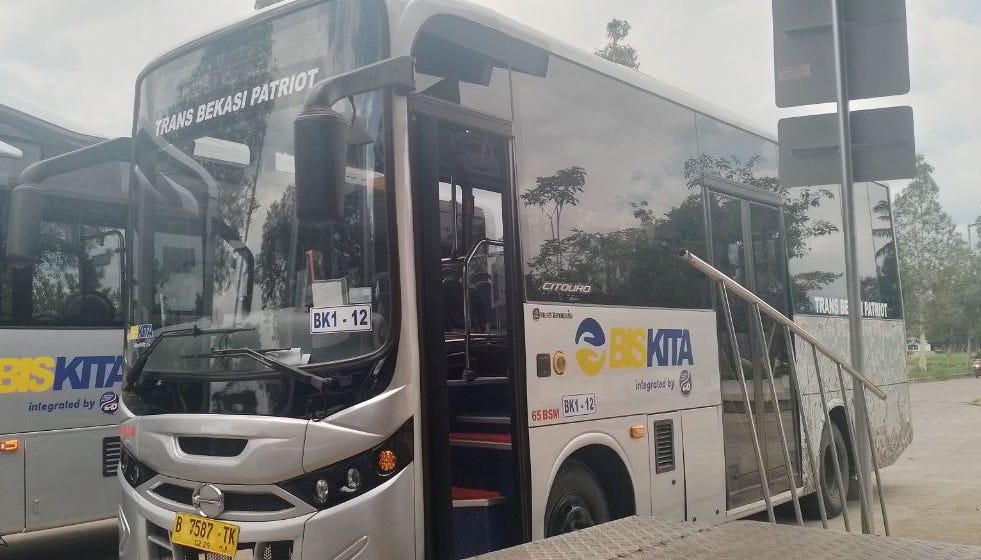
Langkah pertama, naik BisKita.
Lalu, ketika sudah di dalam, aktifkan aplikasi Tracklia dan mulai GPS trackingnya. Dulu saya sudah pernah jelaskan bagaimana cara melakukan GPS tracking menggunakan Tracklia.
Dari Stadion Patriot Chandrabhaga (11.26), akhirnya sampai di halte Pasar Alam Vida (12.28).
Segera stop proses GPS trackingnya, lalu export hasil tracking itu ke format GPX.
Konversi file GPX itu ke dalam format SHP sembari kita hitung kecepatan rata-rata tiap titiknya.
import gpxpy
import shapefile

def convert_gpx_to_shp(gpx_file, shp_file):
    # Create a new Shapefile
    shp_writer = shapefile.Writer(shp_file)
    shp_writer.autoBalance = 1

    # Define the Shapefile fields
    shp_writer.field('AverageSpeed', 'F', 10, 6)
    shp_writer.field('Timestamp', 'C', 30)

    # Load the GPX file
    with open(gpx_file, 'r') as f:
        gpx = gpxpy.parse(f)

    # Iterate over each track in the GPX file
    for track in gpx.tracks:
        # Iterate over each segment in the track
        for segment in track.segments:
            # Iterate over each point in the segment
            for i, point in enumerate(segment.points):
                # Calculate the average speed
                if i > 0:
                    distance = point.distance_2d(segment.points[i-1])
                    time_diff = point.time - segment.points[i-1].time
                    speed_mps = distance / time_diff.total_seconds()
                    speed_kmph = speed_mps * 3.6  # Convert m/s to km/h
                    timestamp = point.time.strftime('%Y-%m-%d %H:%M:%S')
                    shp_writer.point(point.longitude, point.latitude)
                    shp_writer.record(speed_kmph, timestamp)

    # Save the Shapefile
    shp_writer.close()

# Usage example
gpx_file = 'b.gpx'
shp_file = 'd.shp'
convert_gpx_to_shp(gpx_file, shp_file)
Buka SHP itu di QGIS. Klik kanan layer GPXnya, export, save features as, GeoJSON.
Lalu, buat webmap untuk menampilkan GeoJSON tersebut menggunakan Leaflet.
<!DOCTYPE html>
<html>
<head>
<meta charset="utf-8" />
<title>Analisis BisKita</title>
<link rel="icon" href="https://storage.googleapis.com/wikibase-cloud-static/sites/530e38a80de265137fa0959f83556801/logos/64.ico?u=1709193904">
<meta name="viewport" content="width=device-width, initial-scale=1">
<link rel="stylesheet" href="https://unpkg.com/leaflet/dist/leaflet.css" />
<style>
#map {
position: absolute;
top: 0px;
left: 0px;
width: 100%;
height: 100%;
}
</style>
</head>
<body>
<div id="map"></div>
<script src="https://unpkg.com/leaflet/dist/leaflet.js"></script>
<script src="https://unpkg.com/leaflet-ajax/dist/leaflet.ajax.min.js"></script>
<script>
// Function to format the date and time as "YYYY-MM-DD HH:mm:ss"
function formatDate(date) {
var year = date.getFullYear();
var month = padZero(date.getMonth() + 1);
var day = padZero(date.getDate());
var hours = padZero(date.getHours());
var minutes = padZero(date.getMinutes());
var seconds = padZero(date.getSeconds());
return year + "-" + month + "-" + day + " " + hours + ":" + minutes + ":" + seconds;
}
// Function to pad a number with leading zeros if necessary
function padZero(num) {
return num.toString().padStart(2, "0");
}
// Initialize the map
var map = L.map('map').setView([-6.2870, 106.9979], 13);
// Create the tile layer with OpenStreetMap data
L.tileLayer('https://{s}.tile.openstreetmap.org/{z}/{x}/{y}.png', {
attribution: '© <a href="https://www.openstreetmap.org/copyright">OSM</a> | Data kecepatan BisKita diambil berdasarkan GPS tracking pada tanggal 4 Maret 2024 (11.26 dari halte <a href="https://maps.app.goo.gl/DXcpNgW8PoGvRTrG9">Samedja Ahmad Yani</a> - 12.28 di halte <a href="https://maps.app.goo.gl/gBHT2fsLXcnf47uSA">Pasar Alam Vida</a>). Klik titik berwarna untuk informasi tambahan.'
}).addTo(map);
// Load and display the GeoJSON data
var geojsonLayer = new L.GeoJSON.AJAX("improved.geojson", {
pointToLayer: function(feature, latlng) {
// Get the "AverageSpe" value and calculate the color
var speed = feature.properties.AverageSpe;
var color = getColor(speed);
// Create a colored circle marker
return L.circleMarker(latlng, {
radius: 10, // Adjust the radius as needed
fillColor: color,
color: '#000',
weight: 1,
opacity: 0,
fillOpacity: 1,
});
},
onEachFeature: function(feature, layer) {
// Bind a popup with point properties
var popupContent = '';
var cc = 0
for(var property in feature.properties) {
if(cc == 0) {
popupContent += '<b>Kecepatan:</b> ' + feature.properties[property].toFixed(2) + ' km/jam <br>';
cc = cc + 1
} else {
var dateObj = new Date(feature.properties[property]);
// Add 7 hours to the date object
dateObj.setHours(dateObj.getHours() + 7);
// Format the modified date and time
var modifiedDateTime = formatDate(dateObj);
popupContent += '<b>Waktu GPS tracking :</b> ' + modifiedDateTime + '<br>';
}
}
layer.bindPopup(popupContent);
}
}).addTo(map);
// Define the color gradient based on speed
function getColor(speed) {
var maxSpeed = 37; // Maximum speed value
var minHue = 240; // Hue for slow speeds (blue)
var maxHue = 0; // Hue for high speeds (red)
// Calculate the hue value based on the speed
var hue = ((speed - 0) / (maxSpeed - 0)) * (maxHue - minHue) + minHue;
return 'hsl(' + hue + ', 100%, 50%)';
}
</script>
</body>
</html>Selesai. Berikut adalah hasil akhirnya.


